

Let's start a conversation. Contact us at previnsights@iu.edu
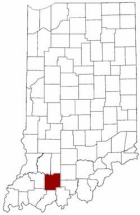
Population Counts by Gender/Age/Race: Dubois, IN
Year of Data: 2022
Data Source: U.S. Census Bureau, 2018-2022 American Community Survey 5-Year Estimates
Data Source: U.S. Census Bureau, 2018-2022 American Community Survey 5-Year Estimates
Table 1.1 Population Counts by Gender/Age/Race
| 0-17 | 18-24 | 25-44 | 45-64 | 65+ | ||
|---|---|---|---|---|---|---|
| Dubois Total population | 43,584 | 10,605 | 3,510 | 10,076 | 11,629 | 7,764 |
| Dubois Population by Gender | Male | 5,429 | 1,768 | 5,273 | 5,978 | 3,460 |
| Female | 5,176 | 1,742 | 4,803 | 5,651 | 4,304 | |
| Indiana Total population | 6,784,403 | 1,577,461 | 674,851 | 1,731,944 | 1,702,946 | 1,097,201 |
| Indiana Population by Gender | Male | 808,505 | 346,812 | 874,531 | 849,288 | 487,662 |
| Female | 768,956 | 328,039 | 857,413 | 853,658 | 609,539 | |
| Dubois Population by Race | 0-17 | 18-24 | 25-44 | 45-64 | 65+ | |
| White | 8,933 | 3,131 | 8,842 | 11,033 | 7,662 | |
| Black | 361 | 35 | 211 | 72 | 20 | |
| American Indian/Alaska Native | 0 | 0 | 46 | 45 | 1 | |
| Asian | 56 | 12 | 148 | 2 | 2 | |
| Native Hawaiian/Pacific Islander | 0 | 0 | 0 | 0 | 0 | |
| Other Race | 294 | 76 | 590 | 124 | 20 | |
| 2 or More Races | 961 | 256 | 239 | 353 | 59 | |
| Hispanic or Latino (Any Race) | 1,642 | 430 | 1,139 | 508 | 64 | |