

Let's start a conversation. Contact us at previnsights@iu.edu
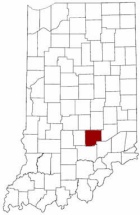
Population Counts by Gender/Age/Race: Bartholomew, IN
Year of Data: 2022
Data Source: U.S. Census Bureau, 2018-2022 American Community Survey 5-Year Estimates
Data Source: U.S. Census Bureau, 2018-2022 American Community Survey 5-Year Estimates
Table 1.1 Population Counts by Gender/Age/Race
| 0-17 | 18-24 | 25-44 | 45-64 | 65+ | ||
|---|---|---|---|---|---|---|
| Bartholomew Total population | 82,371 | 19,690 | 6,612 | 22,409 | 20,157 | 13,503 |
| Bartholomew Population by Gender | Male | 10,053 | 3,560 | 11,697 | 10,287 | 6,073 |
| Female | 9,637 | 3,052 | 10,712 | 9,870 | 7,430 | |
| Indiana Total population | 6,784,403 | 1,577,461 | 674,851 | 1,731,944 | 1,702,946 | 1,097,201 |
| Indiana Population by Gender | Male | 808,505 | 346,812 | 874,531 | 849,288 | 487,662 |
| Female | 768,956 | 328,039 | 857,413 | 853,658 | 609,539 | |
| Bartholomew Population by Race | 0-17 | 18-24 | 25-44 | 45-64 | 65+ | |
| White | 14,828 | 5,445 | 16,462 | 18,034 | 12,843 | |
| Black | 223 | 164 | 370 | 475 | 99 | |
| American Indian/Alaska Native | 13 | 0 | 17 | 7 | 39 | |
| Asian | 1,558 | 375 | 3,676 | 776 | 262 | |
| Native Hawaiian/Pacific Islander | 0 | 0 | 0 | 0 | 0 | |
| Other Race | 1,344 | 206 | 957 | 354 | 38 | |
| 2 or More Races | 1,724 | 422 | 927 | 511 | 222 | |
| Hispanic or Latino (Any Race) | 2,871 | 630 | 1,799 | 1,056 | 157 | |